Charts
Open a station → Chart. Levels are typically shown relative to MLLW (mean lower low water — the long-term average of the daily lowest tide, treated as zero).
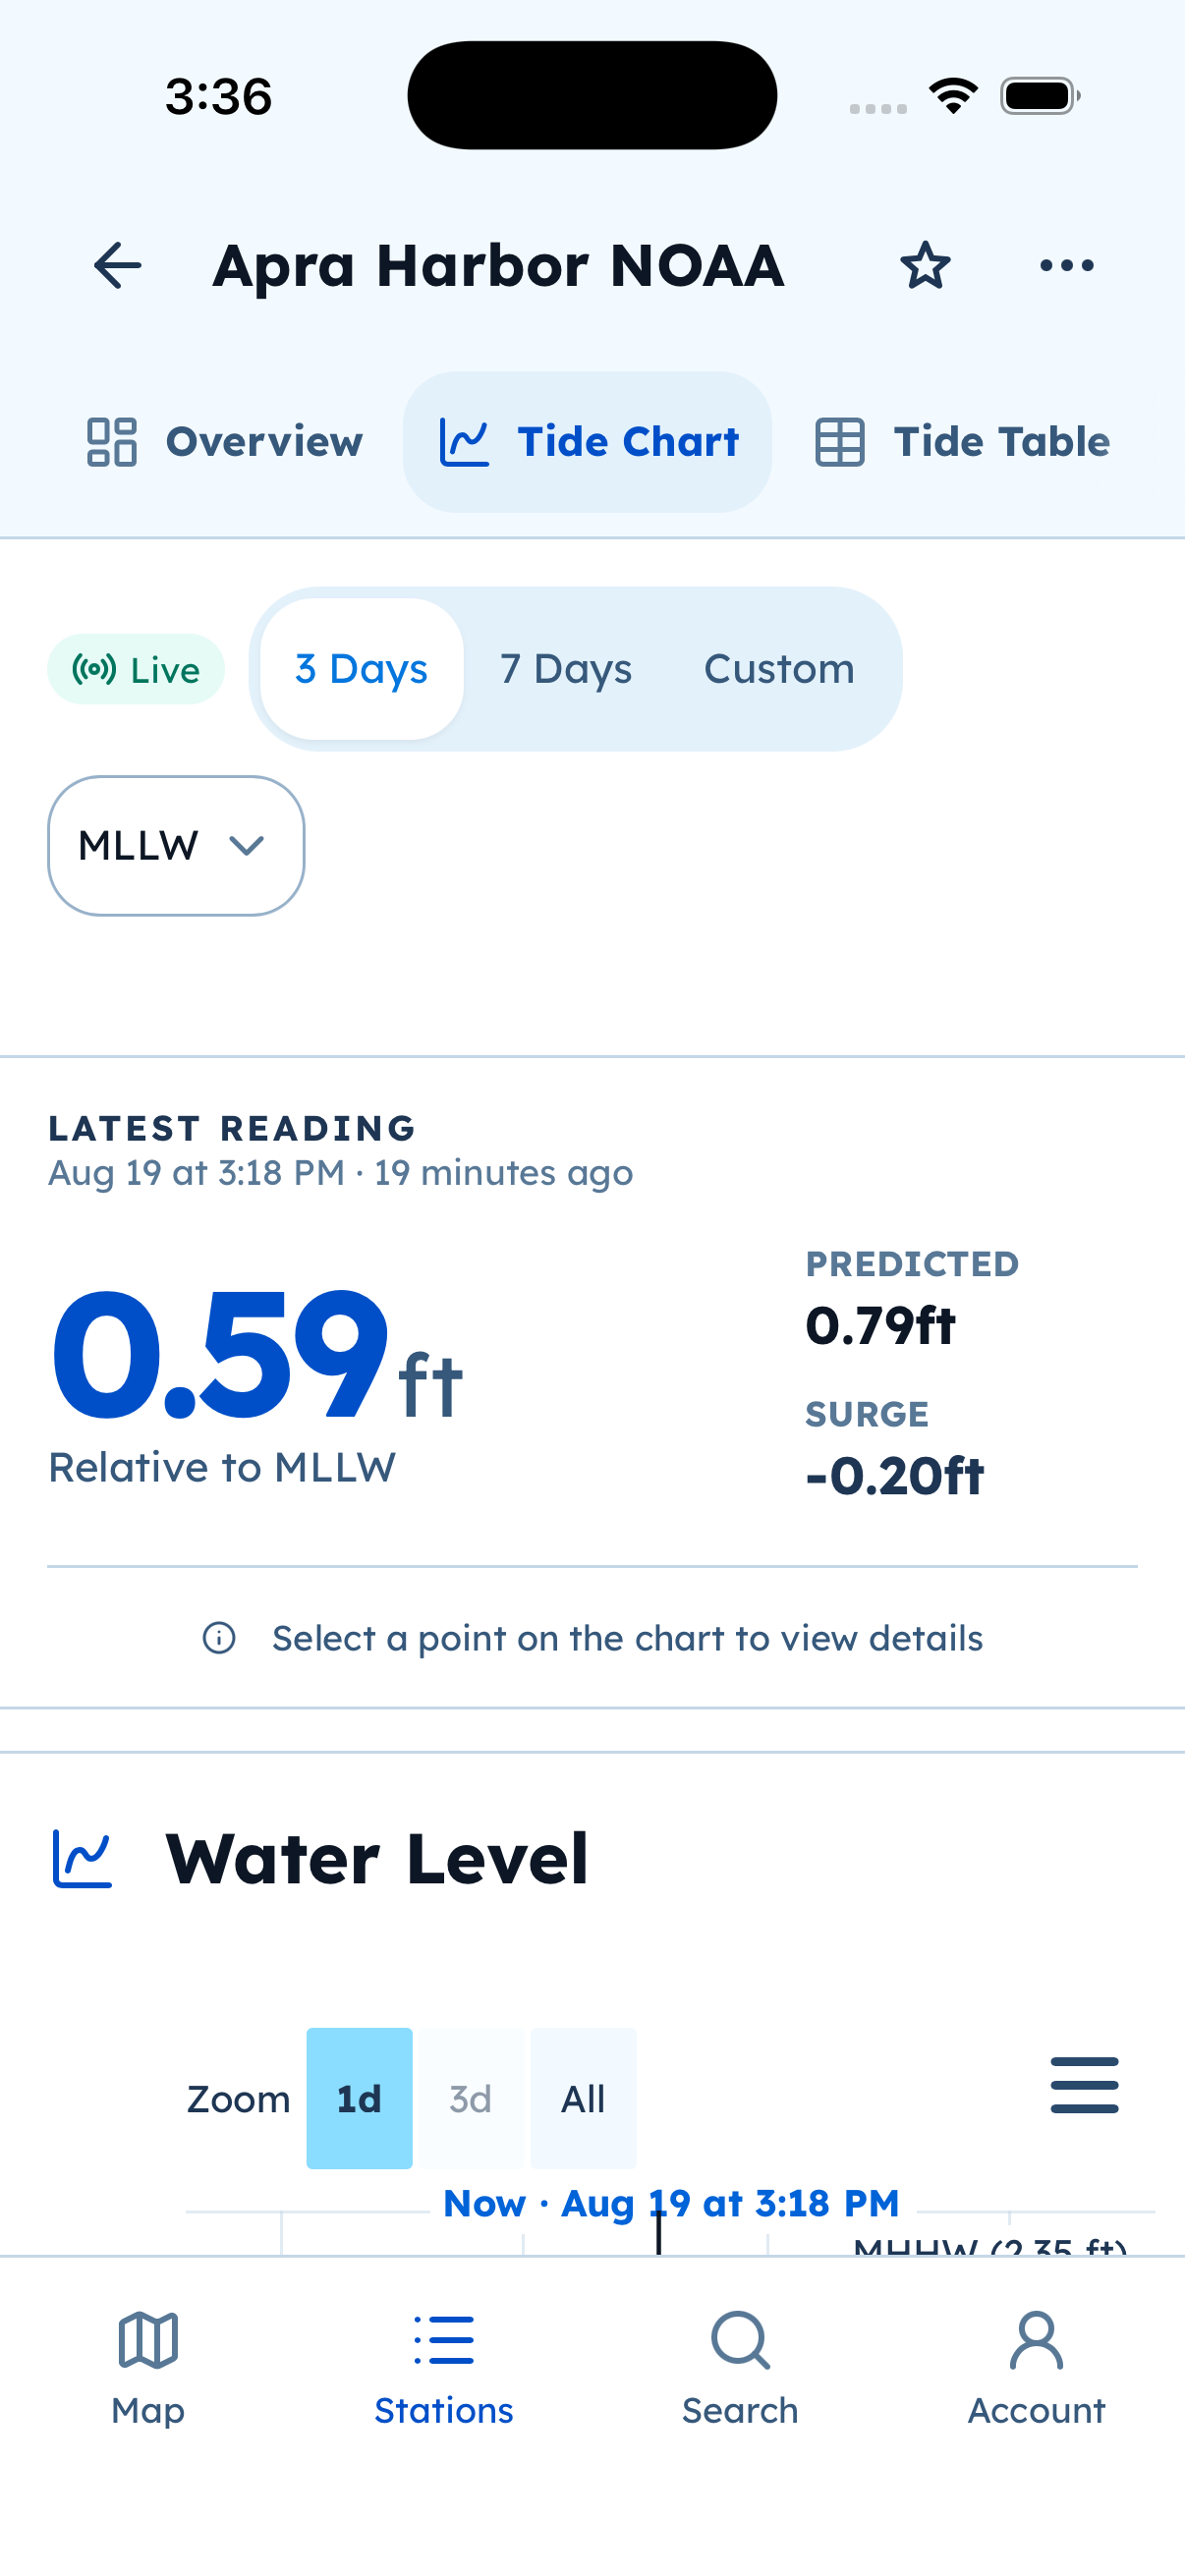
Tide Chart example: MLLW, a 3-day range, predicted vs surge. Exact traces depend on the station.
What you can do
Section titled “What you can do”- Change the visible range with the range control (phones include a compact navigator).
- Expand the chart in the app and share a PNG or JPEG of what you see.
- Observed and predicted traces can disagree when wind, surge, ice, or local effects move the water. That is expected; it is not a hidden “AI” correction.
Charts are available without signing in.